
Platform
Your company's whole performance, in one place.
Finance, operations, continuity, carbon and execution. SUSTYC structures your data, compares it with your targets and turns gaps into tracked actions.
01 · Command Center
Every quarter, what matters in one view.
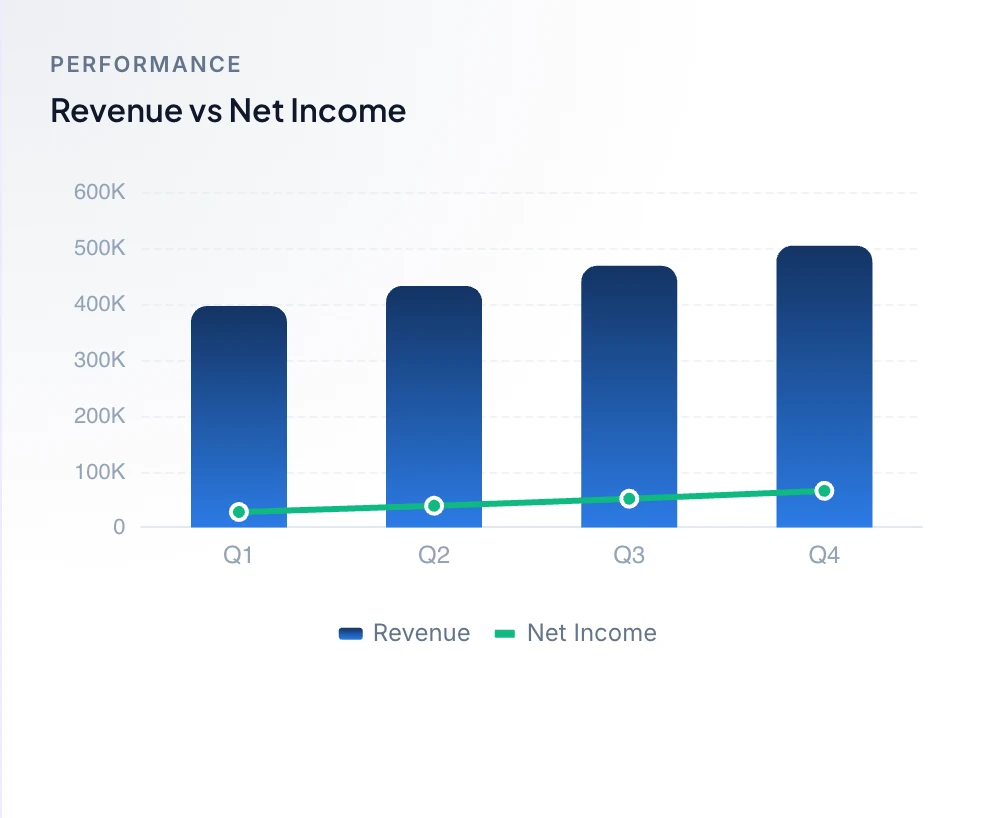
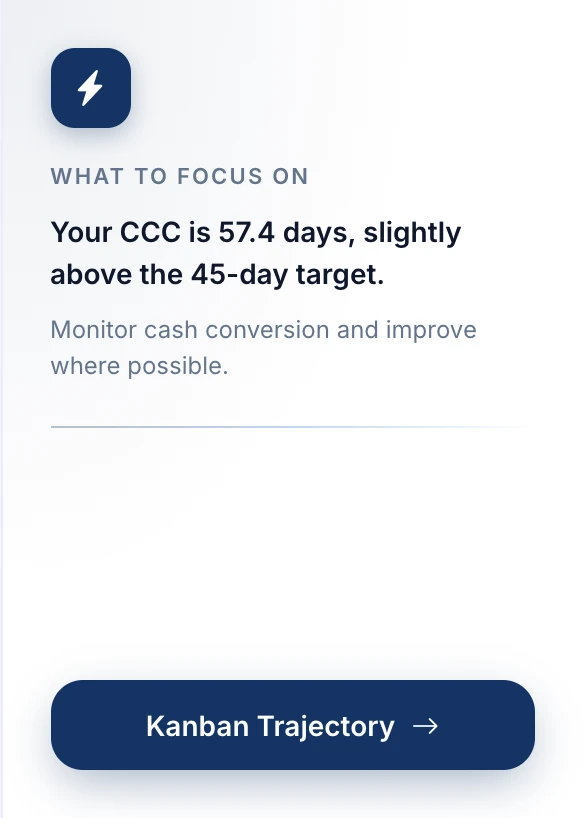
The Command Center tracks your financial and operational indicators quarter after quarter. Each one is compared with its target and given a status, and SUSTYC shows you where to focus.
- 01Cash conversion cycle, collections, margins and operating costs
- 02Revenue, net income and carbon intensity by quarter
- 03A status for every indicator and a clear priority
02 · Costs and working capital
Find where your company is losing money.
Savings start with a well-understood gap. SUSTYC tracks the indicators that reveal tied-up cash, eroding margins and drifting costs, then proposes actions for your managers to prioritize.
01Cash conversion cycle
What it reveals : How many days your money stays tied up in operations.
Possible lever : Reduce working-capital needs
02Days sales outstanding (DSO)
What it reveals : How long your customers take to pay you.
Possible lever : Tighten terms and receivables follow-up
03Inventory days and turnover
What it reveals : Idle inventory and the capital it ties up.
Possible lever : Adjust stock levels and replenishment
04Gross margin
What it reveals : What remains after the cost of goods sold.
Possible lever : Review pricing, product mix or production costs
05Operating expense ratio
What it reveals : The weight of running costs against revenue.
Possible lever : Target the spending lines that drift
06Energy, transport and materials
What it reveals : Consumption that weighs on both your costs and your emissions.
Possible lever : Prioritize the most cost-effective efficiency gains
SUSTYC does not promise quantified savings: it makes gaps visible, proposes actions and helps you track the ones you choose.
03 · The SCORE model
Five pillars to read the whole company.
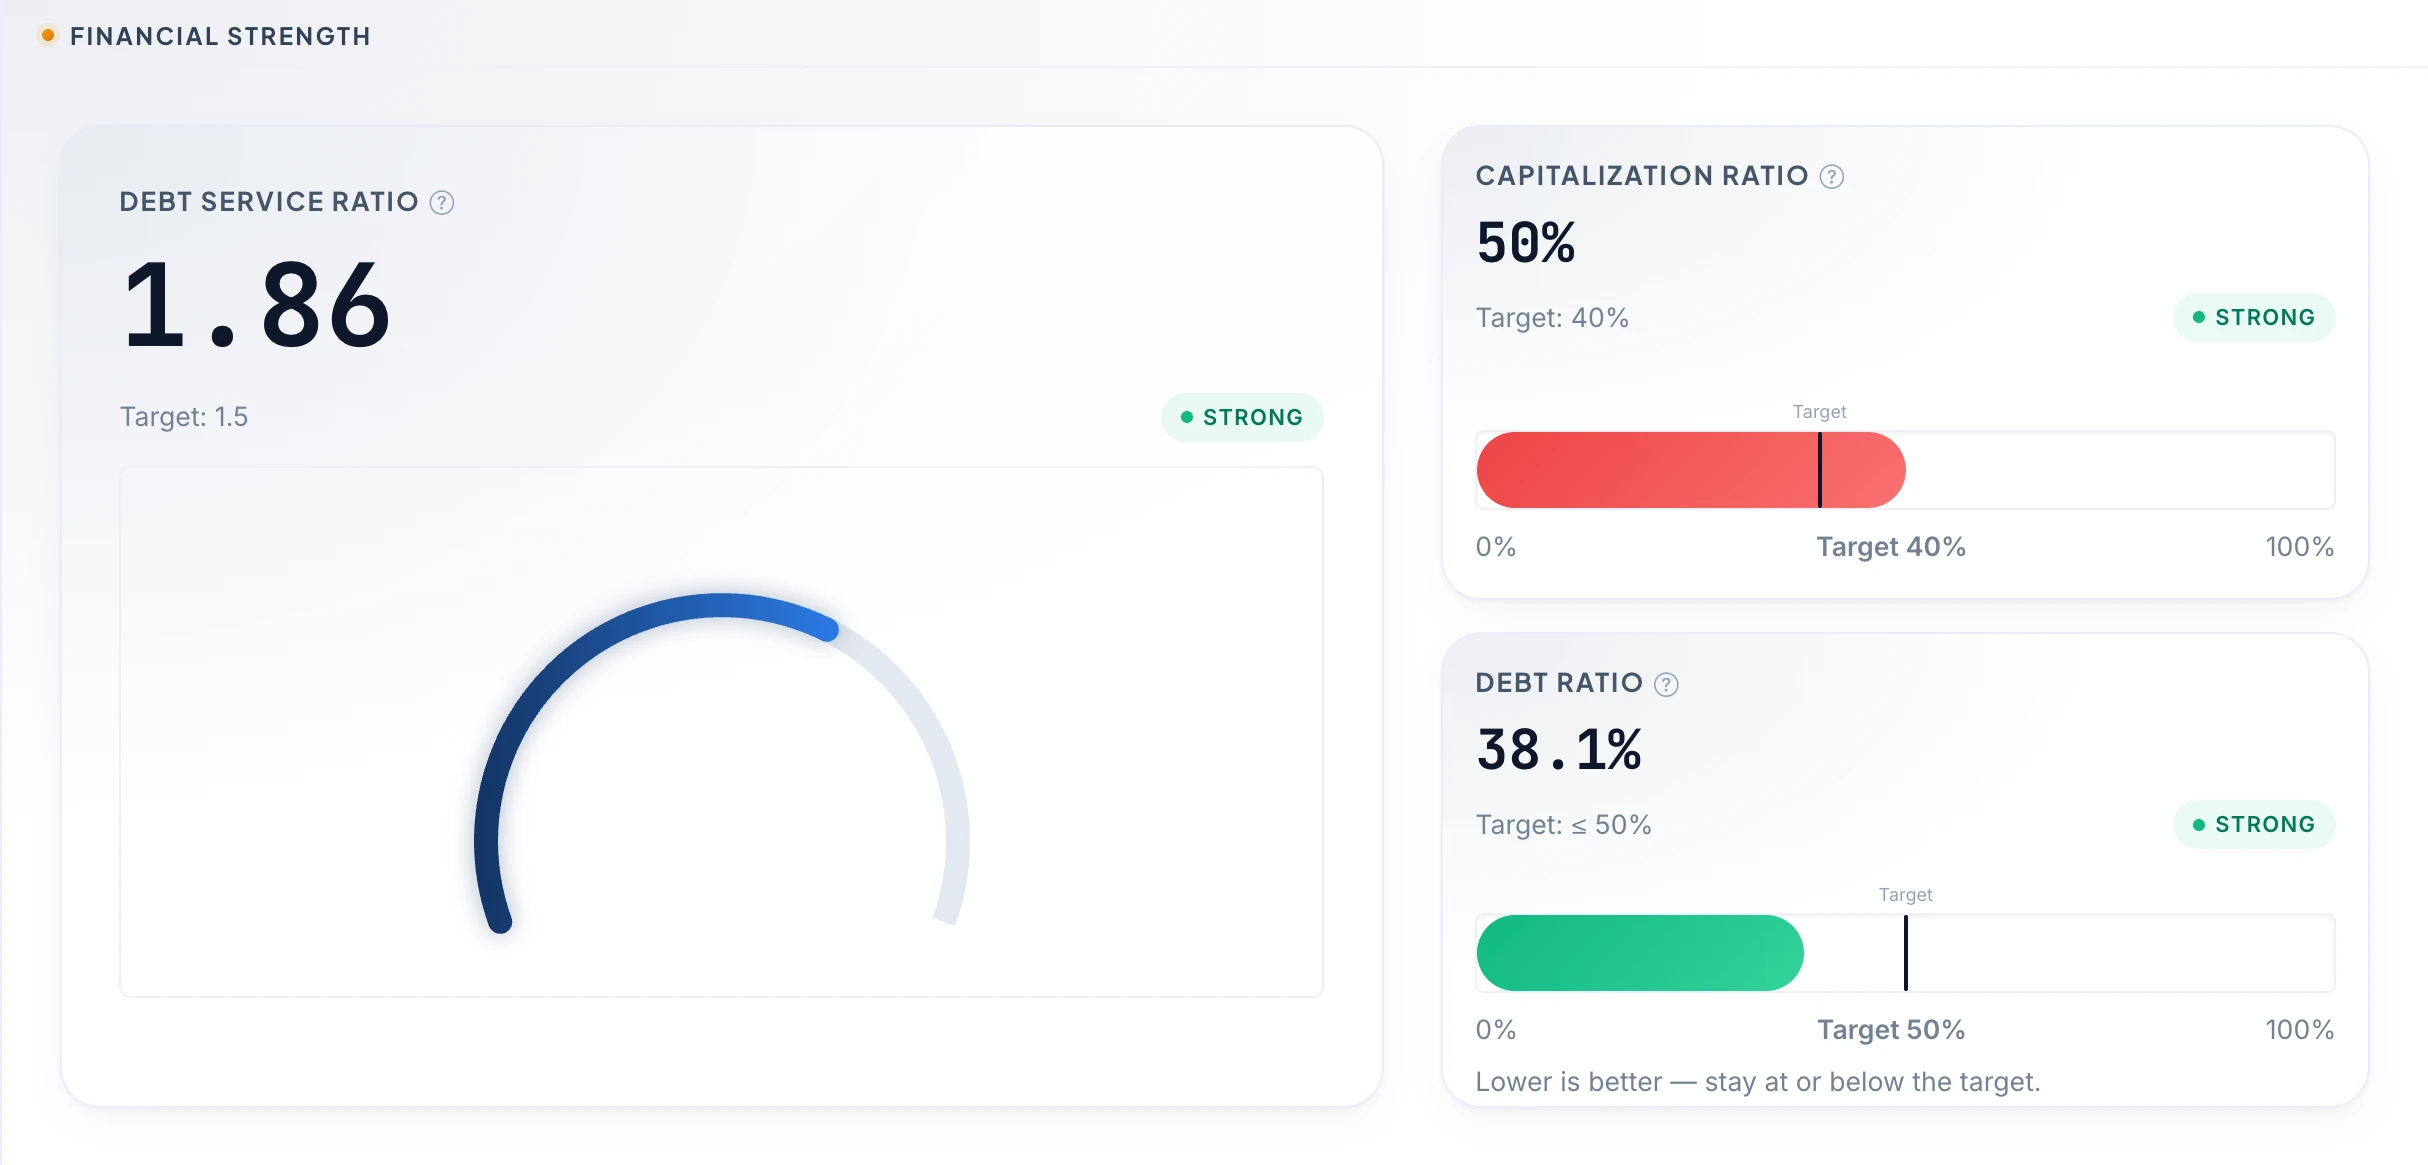
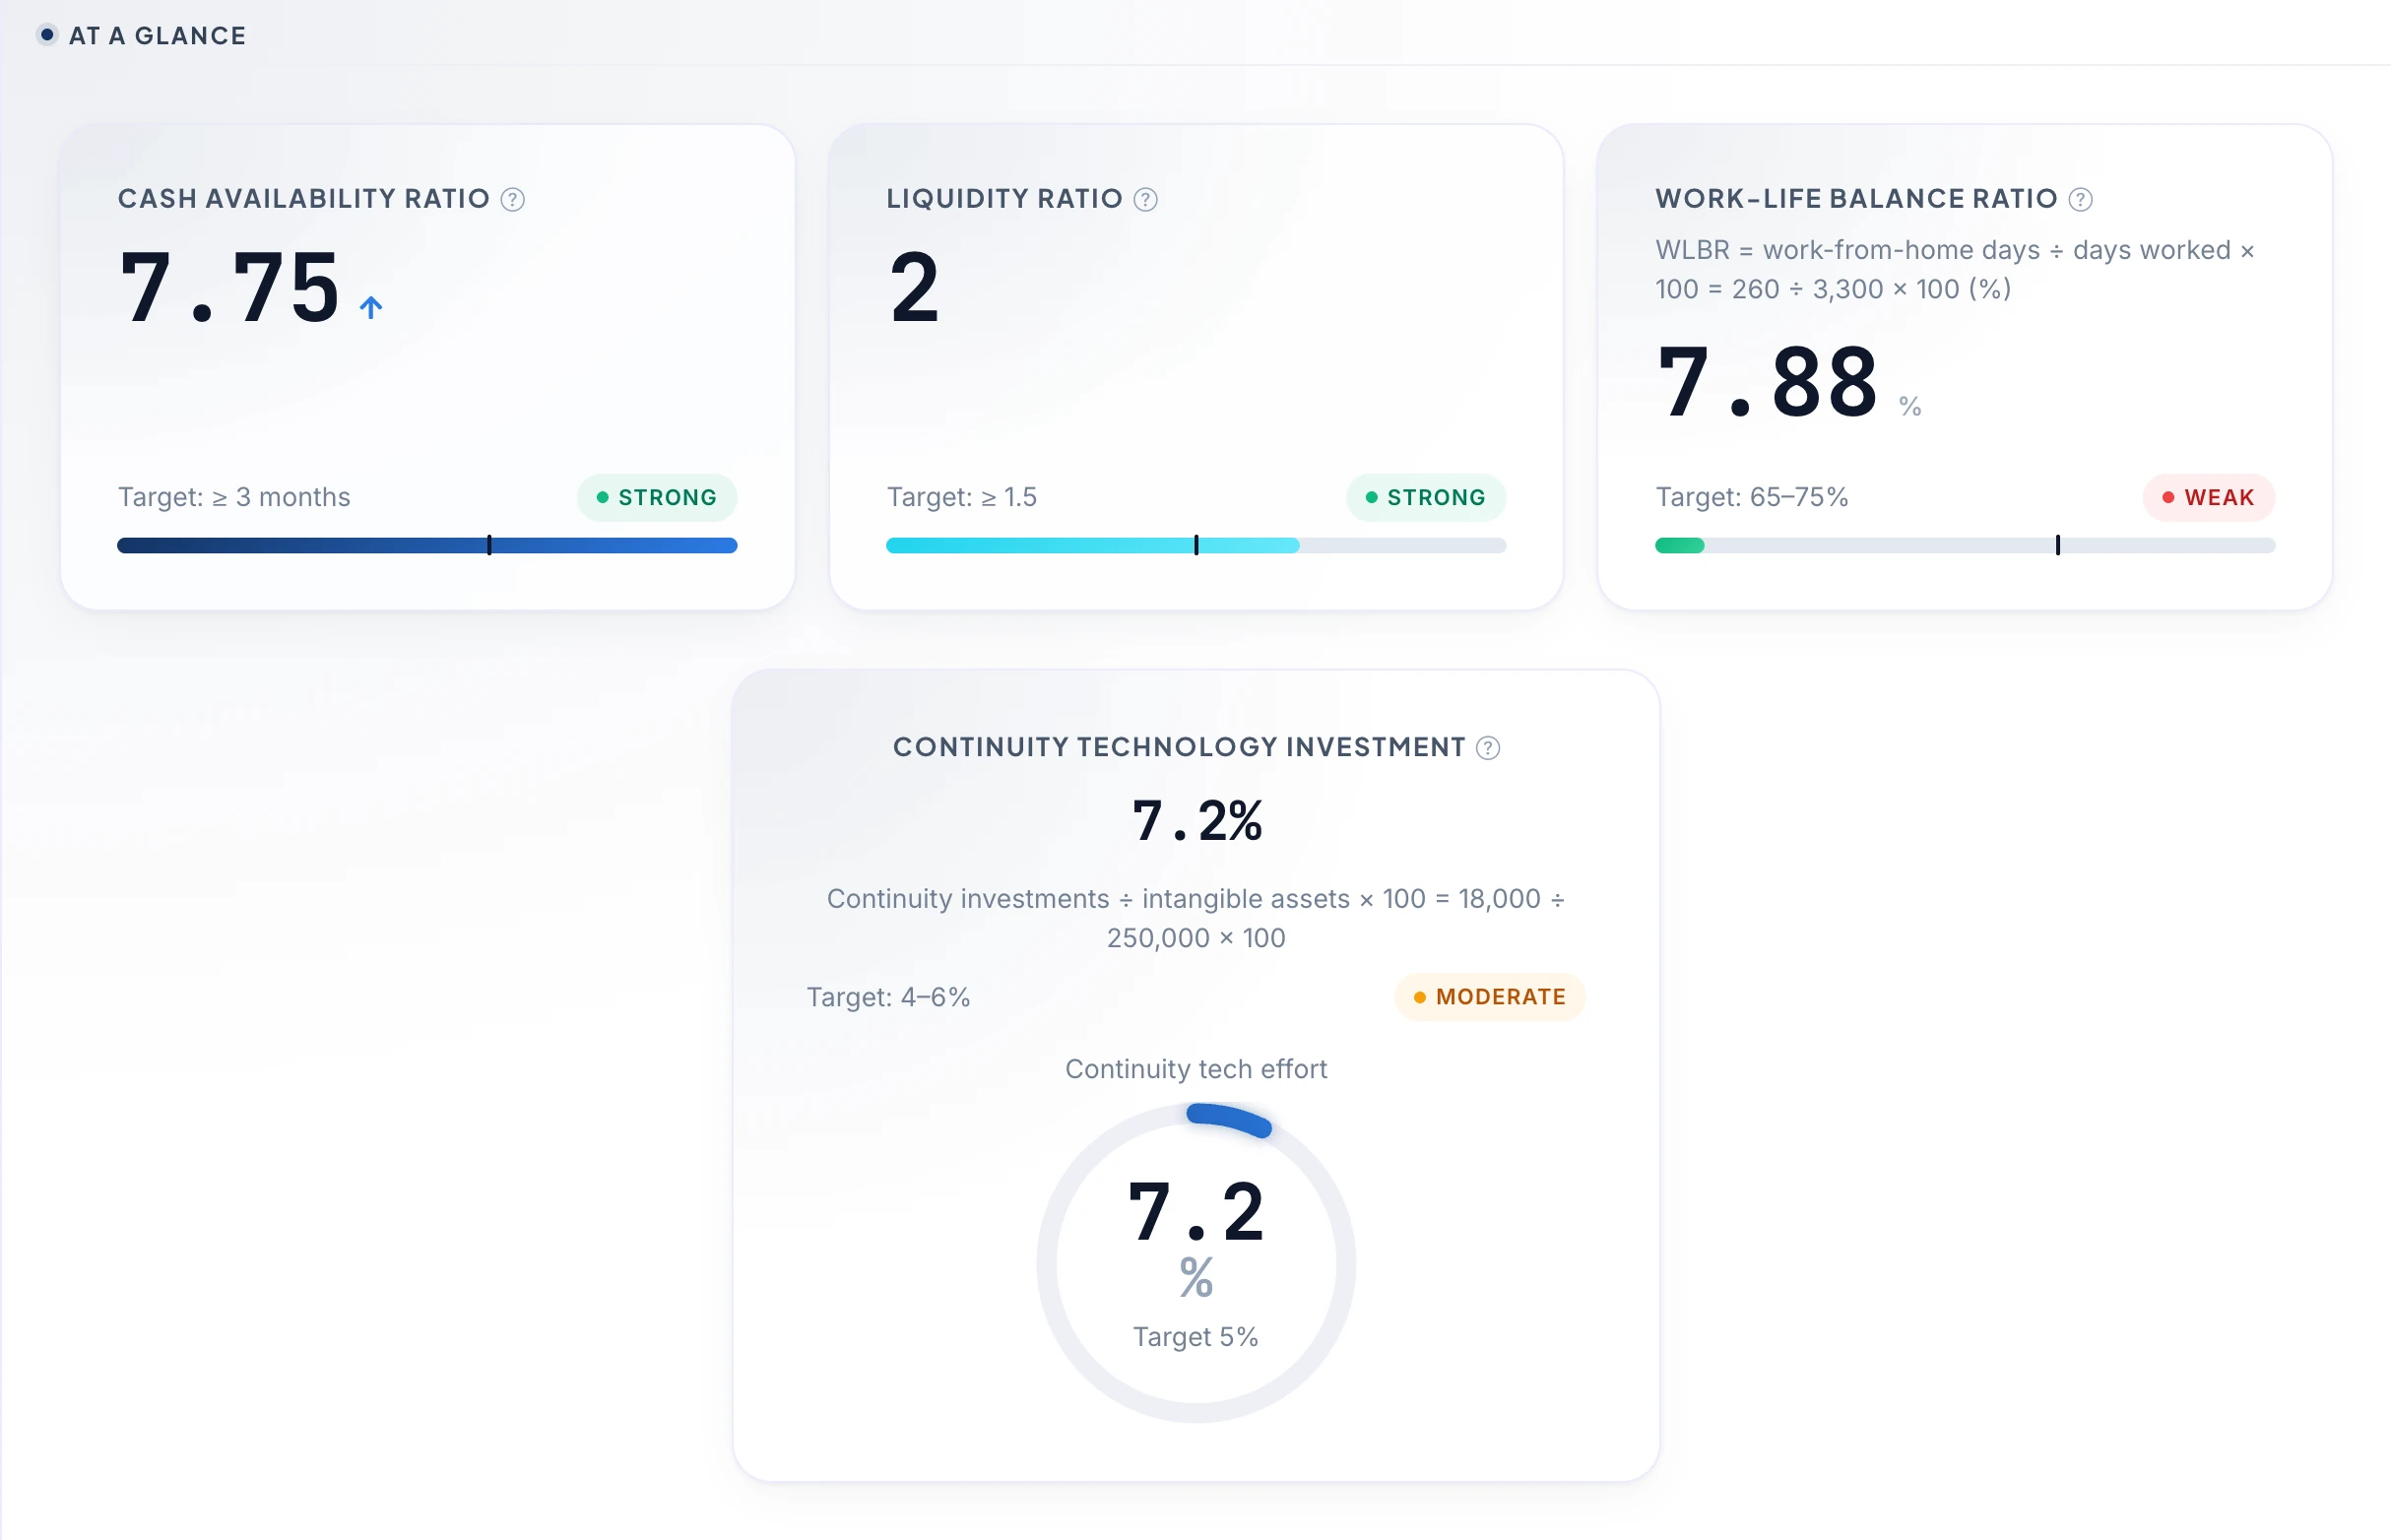
SCORE organizes your dashboards into five pillars. Each one groups indicators with their targets, statuses and annual trends.
Strategy · Drive growth
Financial strength, workforce strategy, ecosystem and engagement.
Continuity · Stay prepared
Structural and operational continuity, staff turnover, health and safety.
Optimization · Use resources better
Circular performance, working capital and training optimization.
Resilience · Withstand shocks
Workforce, governance and supply chain resilience, digital capacity.
Efficiency · Operations and environment
Operational efficiency and environmental efficiency, including GHG emissions.
The dashboards, as they are
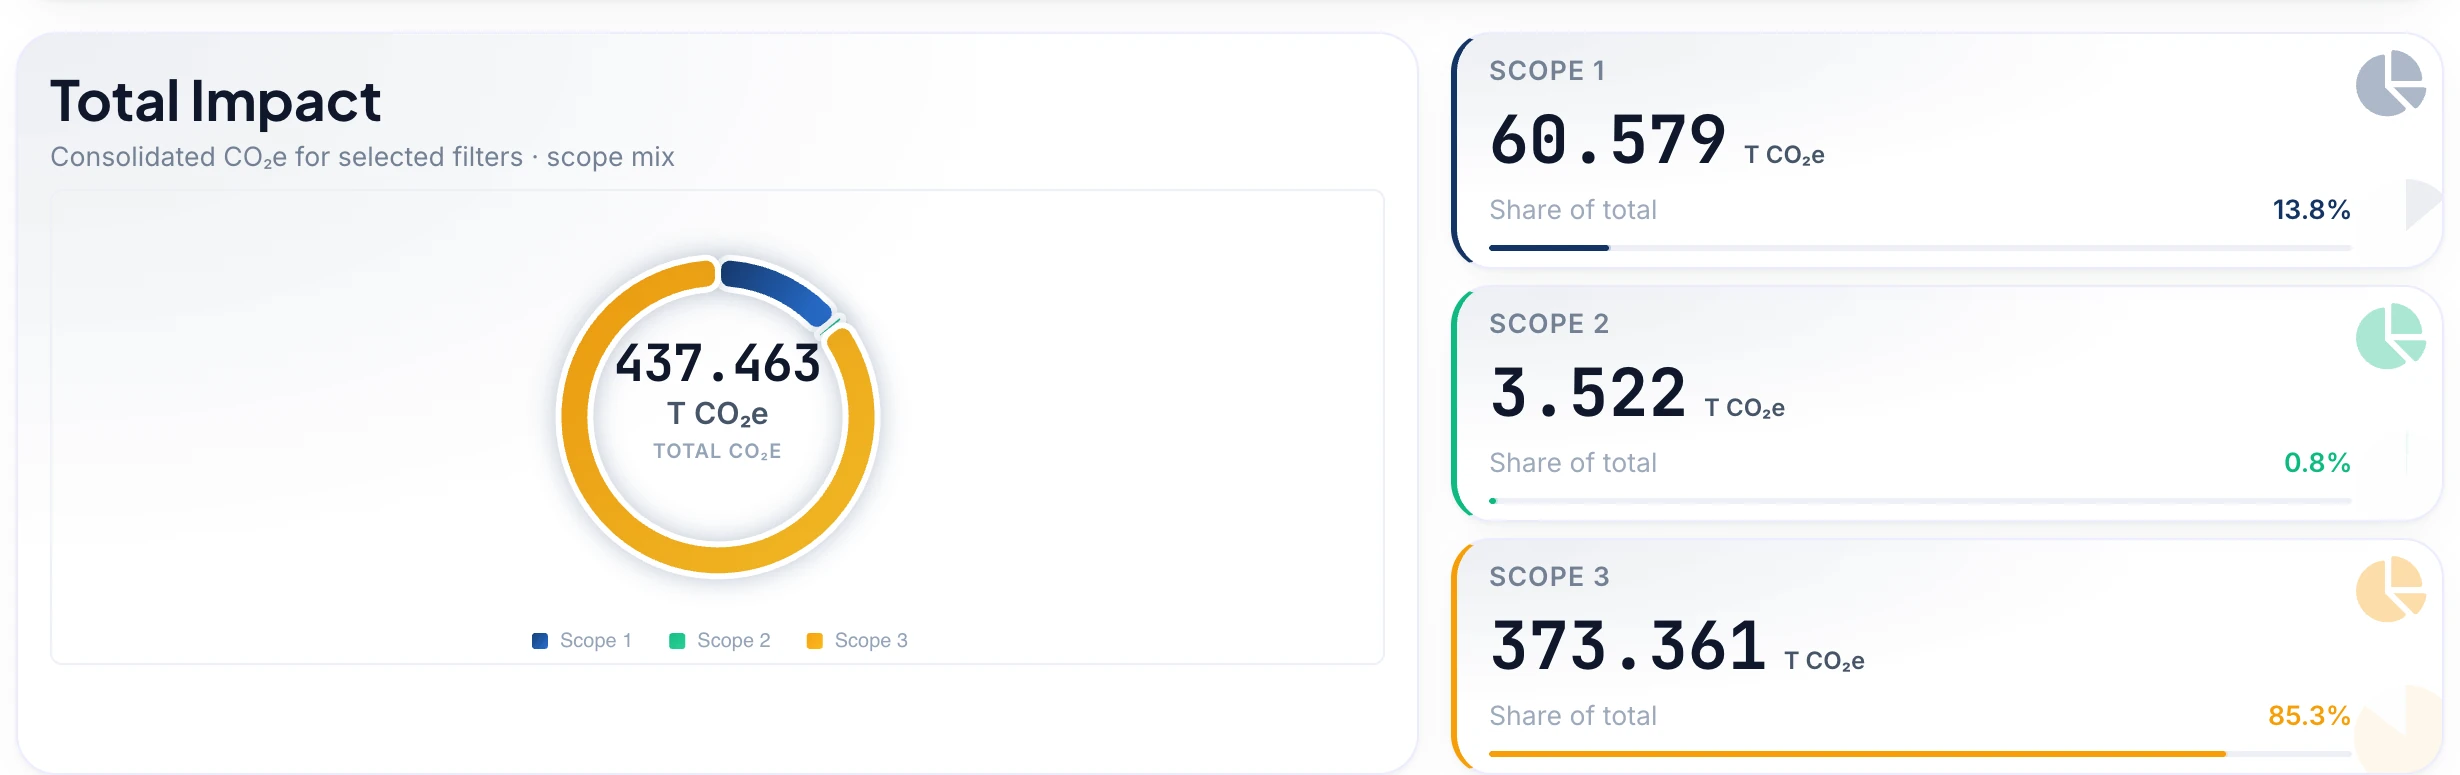
Three examples from the demo company.
04 · Structured data collection
Data entered at the right pace, only once.
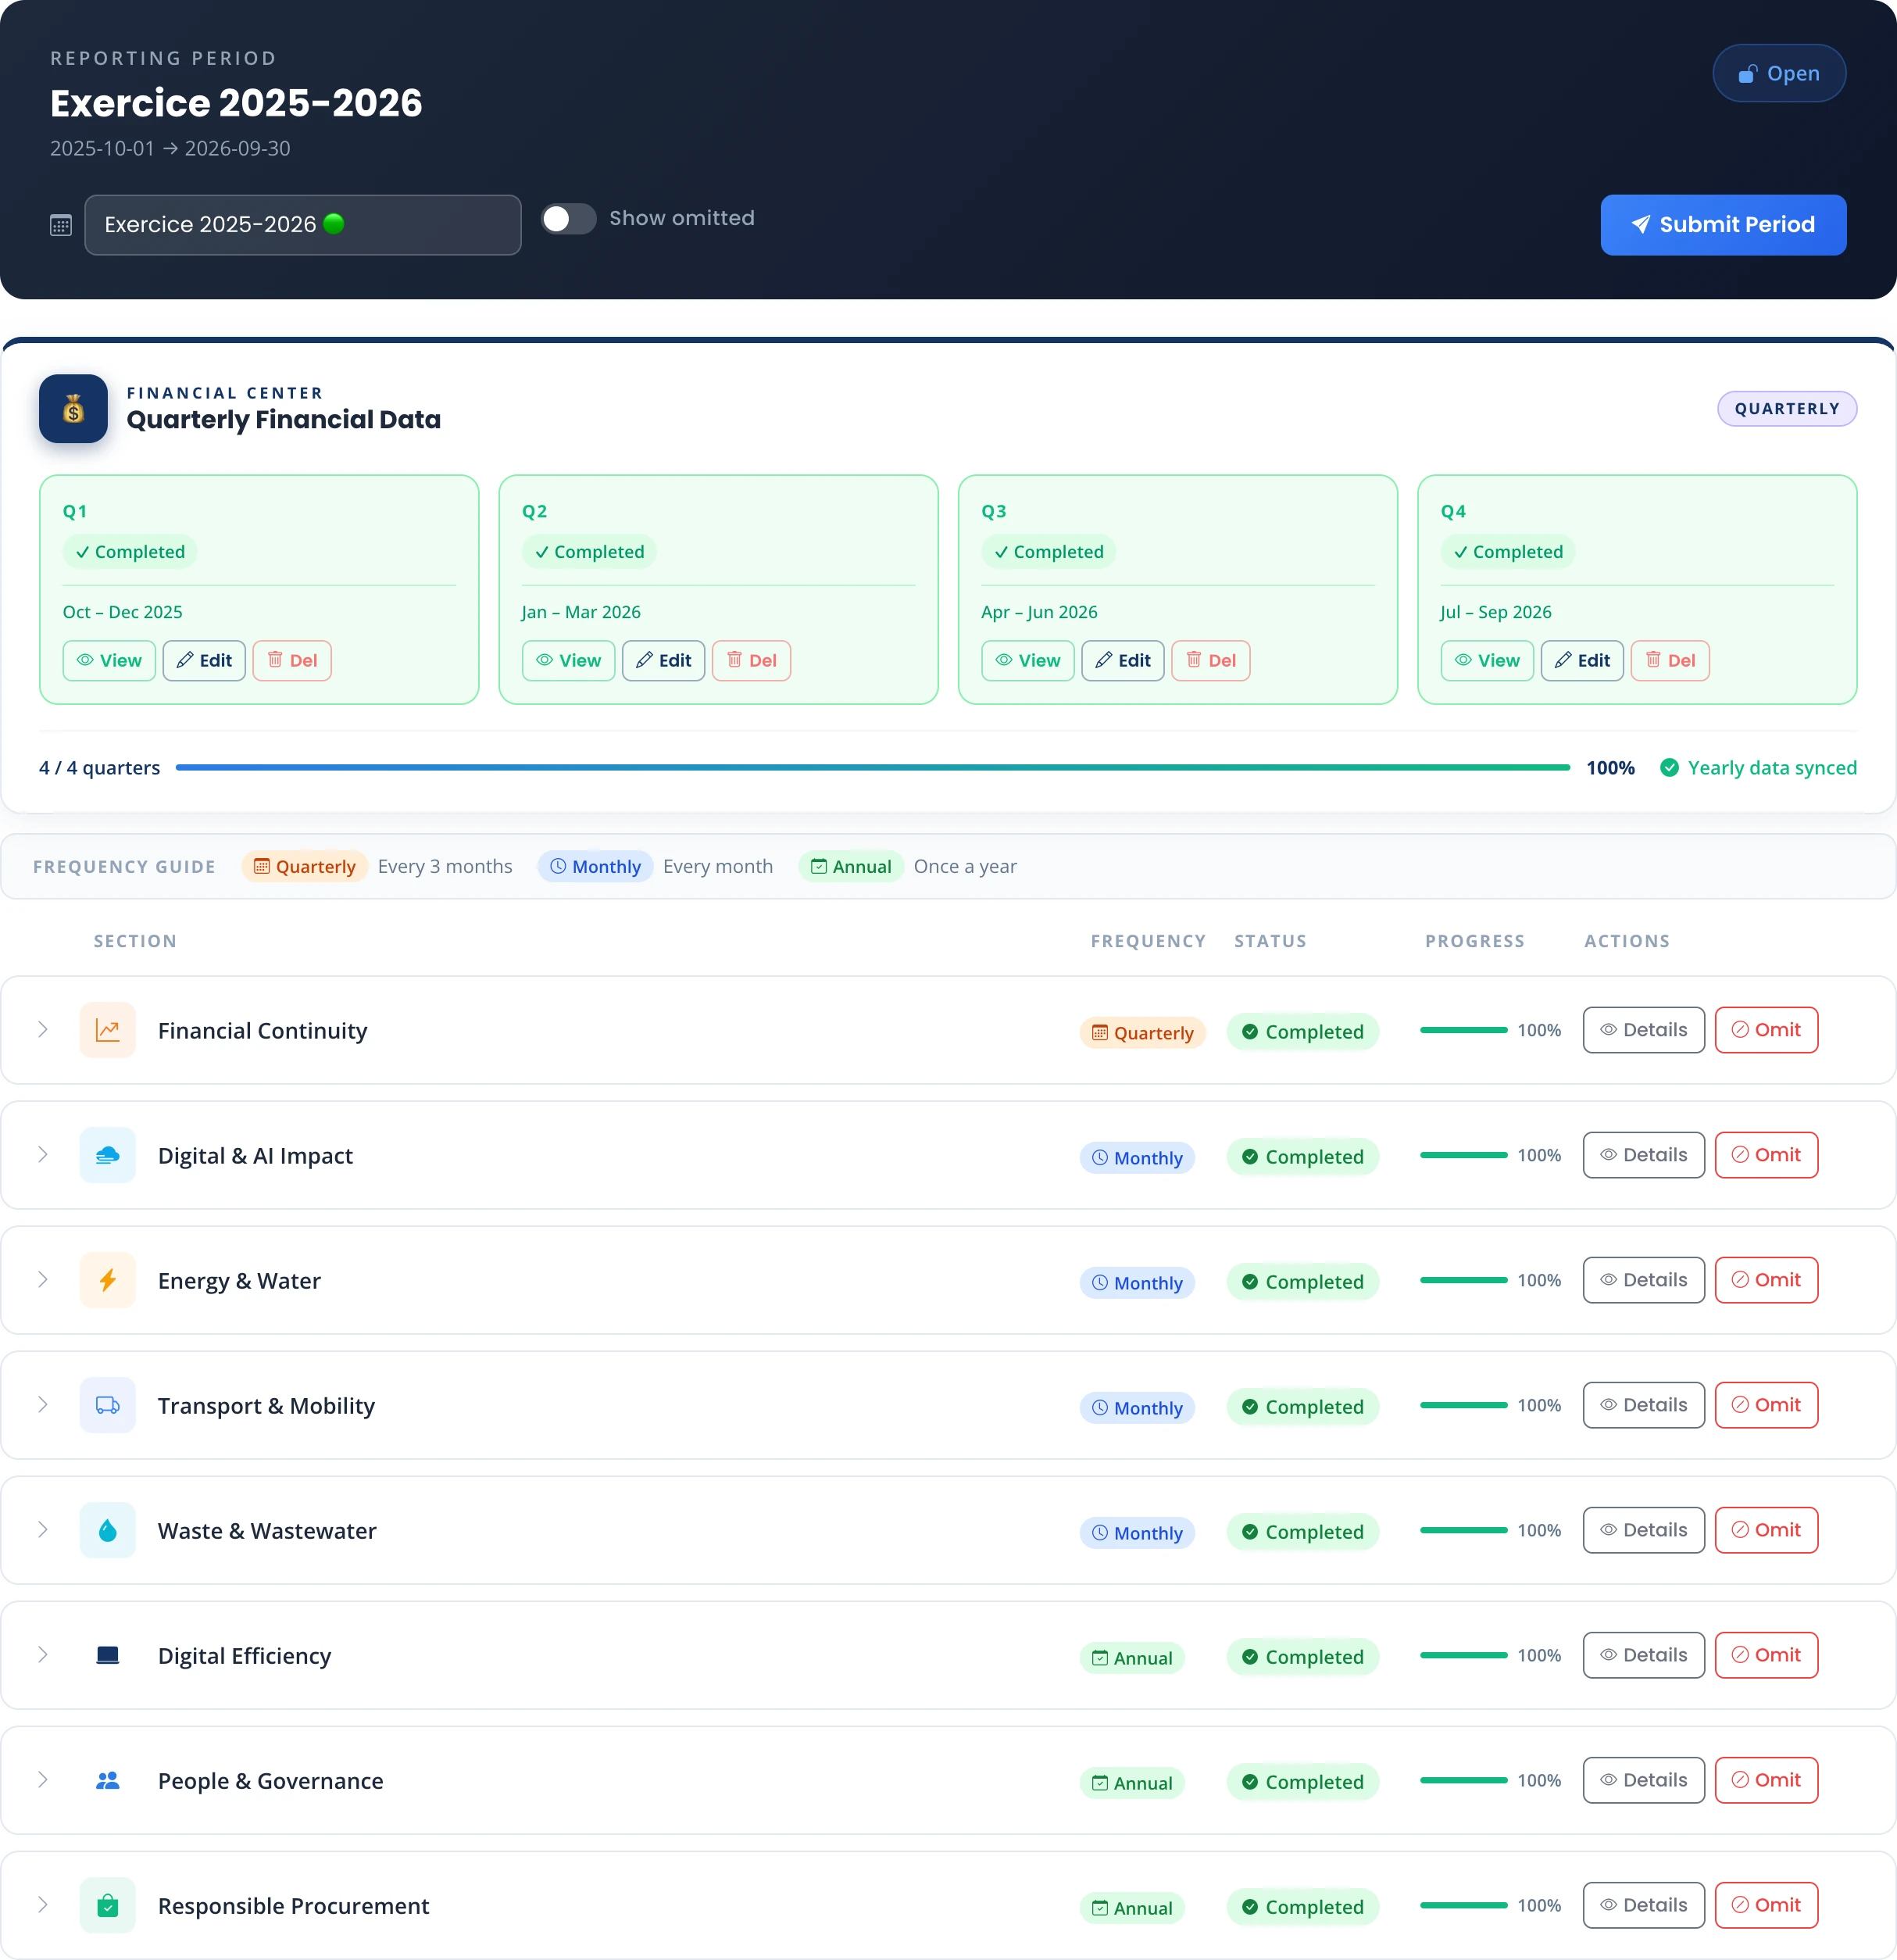
The SCORE Console organizes data entry by reporting period. Each section has its own frequency (quarterly, monthly or annual), status and progress. Quarterly financial data feeds the Command Center directly.
- 01By fiscal year, with a period opened and then submitted
- 02Finance, energy and water, transport, waste, digital, people, purchasing
- 03Visible progress for every section
05 · Carbon and decarbonization
Measure your emissions to reduce them.
SUSTYC keeps your greenhouse gas inventory: Scopes 1 and 2, plus selected Scope 3 categories. You follow emissions by source, category and reporting period, and relate them to your revenue.
01
Spot the hotspots
The sources and categories that weigh most in your inventory stand out right away.
02
Compare periods
Track how your emissions change from one reporting period to the next.
03
Link carbon and revenue
Carbon intensity relates your emissions to your revenue, in the Command Center.
04
Prioritize actions
Gaps feed the action plan, alongside your financial indicators.
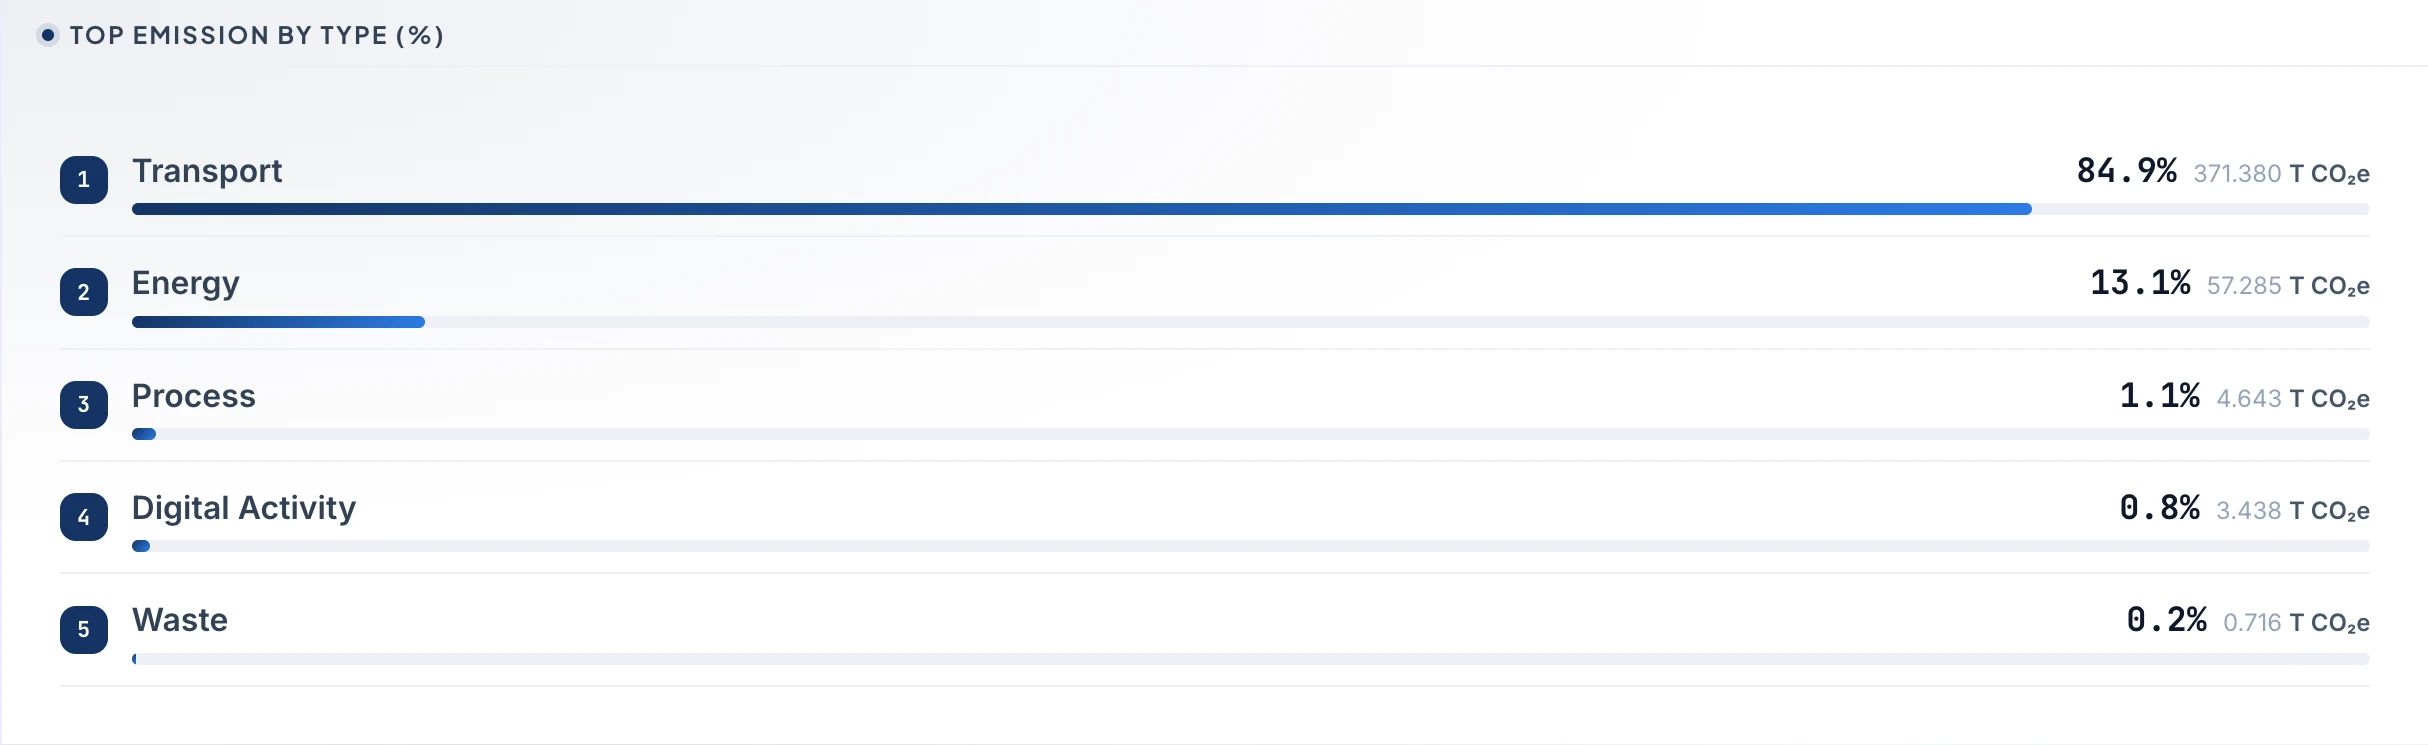
Energy, transport, materials: the items behind your emissions are often the ones that weigh on your costs too. Knowing them better helps you choose actions that benefit both the environment and your profitability.
Product carbon footprint
A five-step workflow allocates your emissions across your products, calculates each one's monthly footprint, then freezes a verifiable snapshot.
- 01Product creation and process choice
- 02Monthly total keys
- 03Product allocation per step
- 04Allocation of emission sources
- 05Delivery footprint calculation

A global perspective
Designed for your market. Built with a global perspective.
SUSTYC is designed to adapt to different business contexts while drawing on recognized international frameworks. Your data becomes more consistent, more comparable and easier to present to partners, customers and lenders.
- Recognized frameworks
- Structured indicators referenced to the GRI Standards, notably for emissions and economic performance.
- Relevant emission factors
- Emission factors selected by the country and region of the activity, where the information is available.
- Your periods, your currency
- Structured fiscal years and reporting periods, in your reporting currency.
- French and English
- A bilingual platform, for your teams and your partners alike.
SUSTYC keeps evolving for new markets. The platform does not replace a country-specific regulatory compliance process.
06 · Action plan and Kanban
From recommendation to completed action.
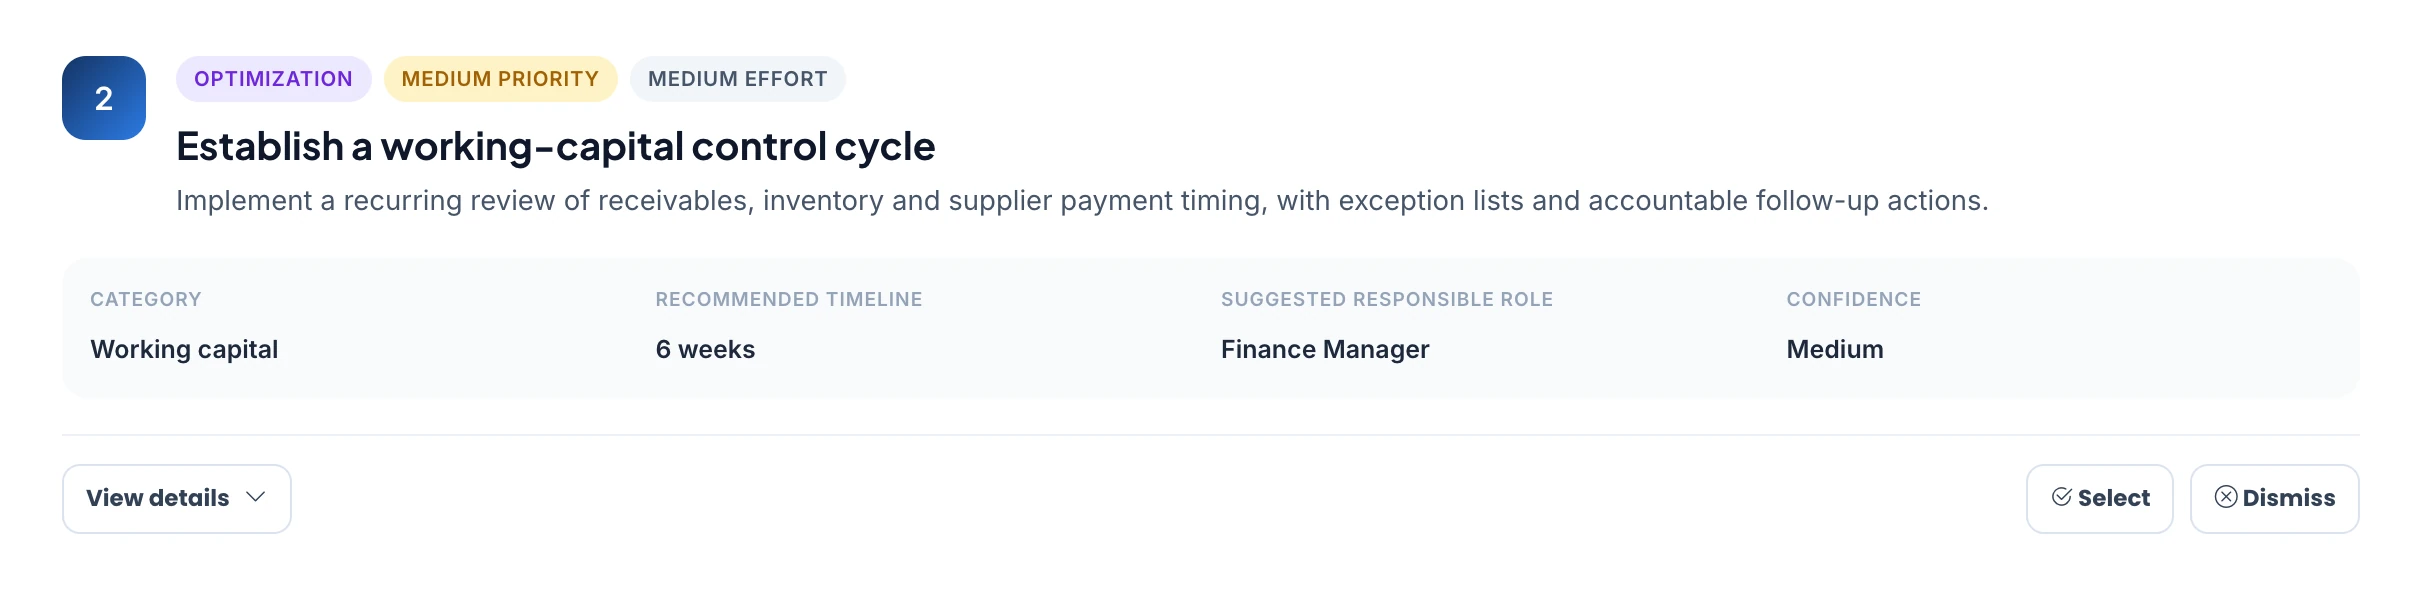
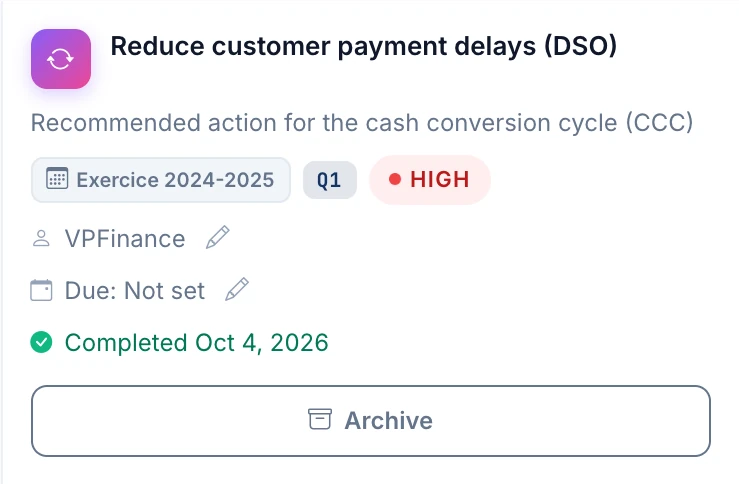
The AI-assisted action plan proposes specific actions based on your gaps. Your managers keep or dismiss them; the ones they keep move to the Kanban, with an owner, until they are done.
01 · Propose
An action, its category, a recommended timeline, a suggested owner role and a confidence level.
02 · Decide
Your managers keep or dismiss each proposal. Nothing moves forward without their approval.
03 · Execute
Kept actions are tracked on the Kanban until they reach Done.
07 · SUSTYC Academy
Your team learns inside the same platform.
The SUSTYC Academy offers short, practical video courses to understand your indicators, enter your data correctly and act on it.
- video courses
- 43
- learning themes
- 14
Courses are mostly in French, with a growing selection in English.
Selected themes
01
Carbon accounting and decarbonization
Understand your carbon footprint and measure the emissions of each source.
02
The SCORE model
A 360° view of company performance.
03
Financial management
Track financial health every quarter and build resilience.
04
The Command Center
Steer quarterly activity with the right indicators.
05
Product carbon footprint
The five steps to calculate a product's footprint.
06
CBAM and international trade
Prepare for the EU Carbon Border Adjustment Mechanism when exporting to Europe.
07
Energy, water and efficiency
Optimize energy, water and digital efficiency.
08
Circular economy and purchasing
Turn waste into resources, make the supply chain more circular, buy responsibly.
And more
- Transport and mobility
- Industrial processes
- Waste and wastewater
- Business succession
- People and governance
- Digital and AI impact
Let's see what SUSTYC can reveal in your numbers.
A guided demonstration of the platform, from your indicators to the action plan.