
Performance management for SMEs
Steer your company's performance, from the number to the decision.
SUSTYC brings your financial, operational and carbon indicators together, proposes an action plan and helps your team see it through.

The expertise behind the platform
The expertise behind the platform
SUSTYC draws on more than 30 years of experience in business management, industrial projects and performance improvement.
Technologies SUSTYC inc.
What SUSTYC brings you
Profitability, efficiency and decarbonization, managed together.
SUSTYC connects your financial results with your operations and your emissions. It becomes easier to see where money, time and energy are lost, and which actions should come first.
01/Cash
Find the cash tied up in your operations.
Cash conversion cycle, days sales outstanding, days and turnover of inventory: SUSTYC shows where your working capital is tied up and compares every indicator with its target.
- Cash cycle
- DSO
- Inventory turnover
02/Costs
Keep operating costs under control.
Gross margin, operating expense ratio and efficiency indicators, quarter after quarter. Indicators below target stand out, with proposed actions to address them.
- Gross margin
- Operating expenses
- Efficiency
03/Carbon
Cut emissions where it makes business sense.
Scope 1, 2 and 3 inventory, carbon intensity against revenue and product footprints. Knowing your energy, transport and materials better helps you choose actions that serve both the environment and your costs.
- Scopes 1, 2 and 3
- Carbon intensity
- Product footprint
Scope 3: selected categories. Results depend on the actions your team decides to take.
From number to decision
An off-target indicator becomes a tracked action.
01
The number
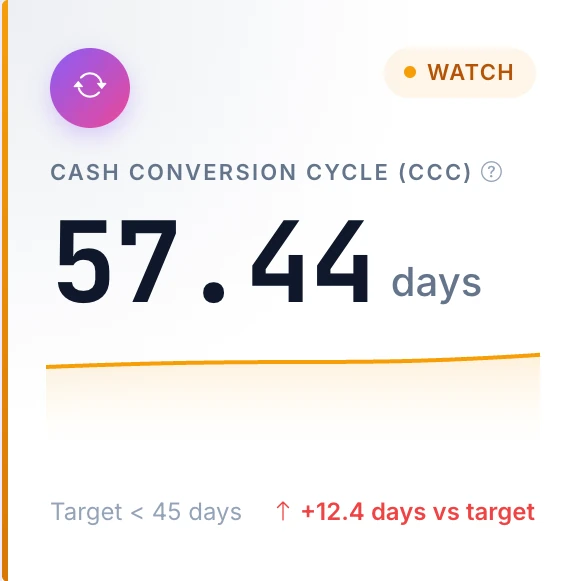
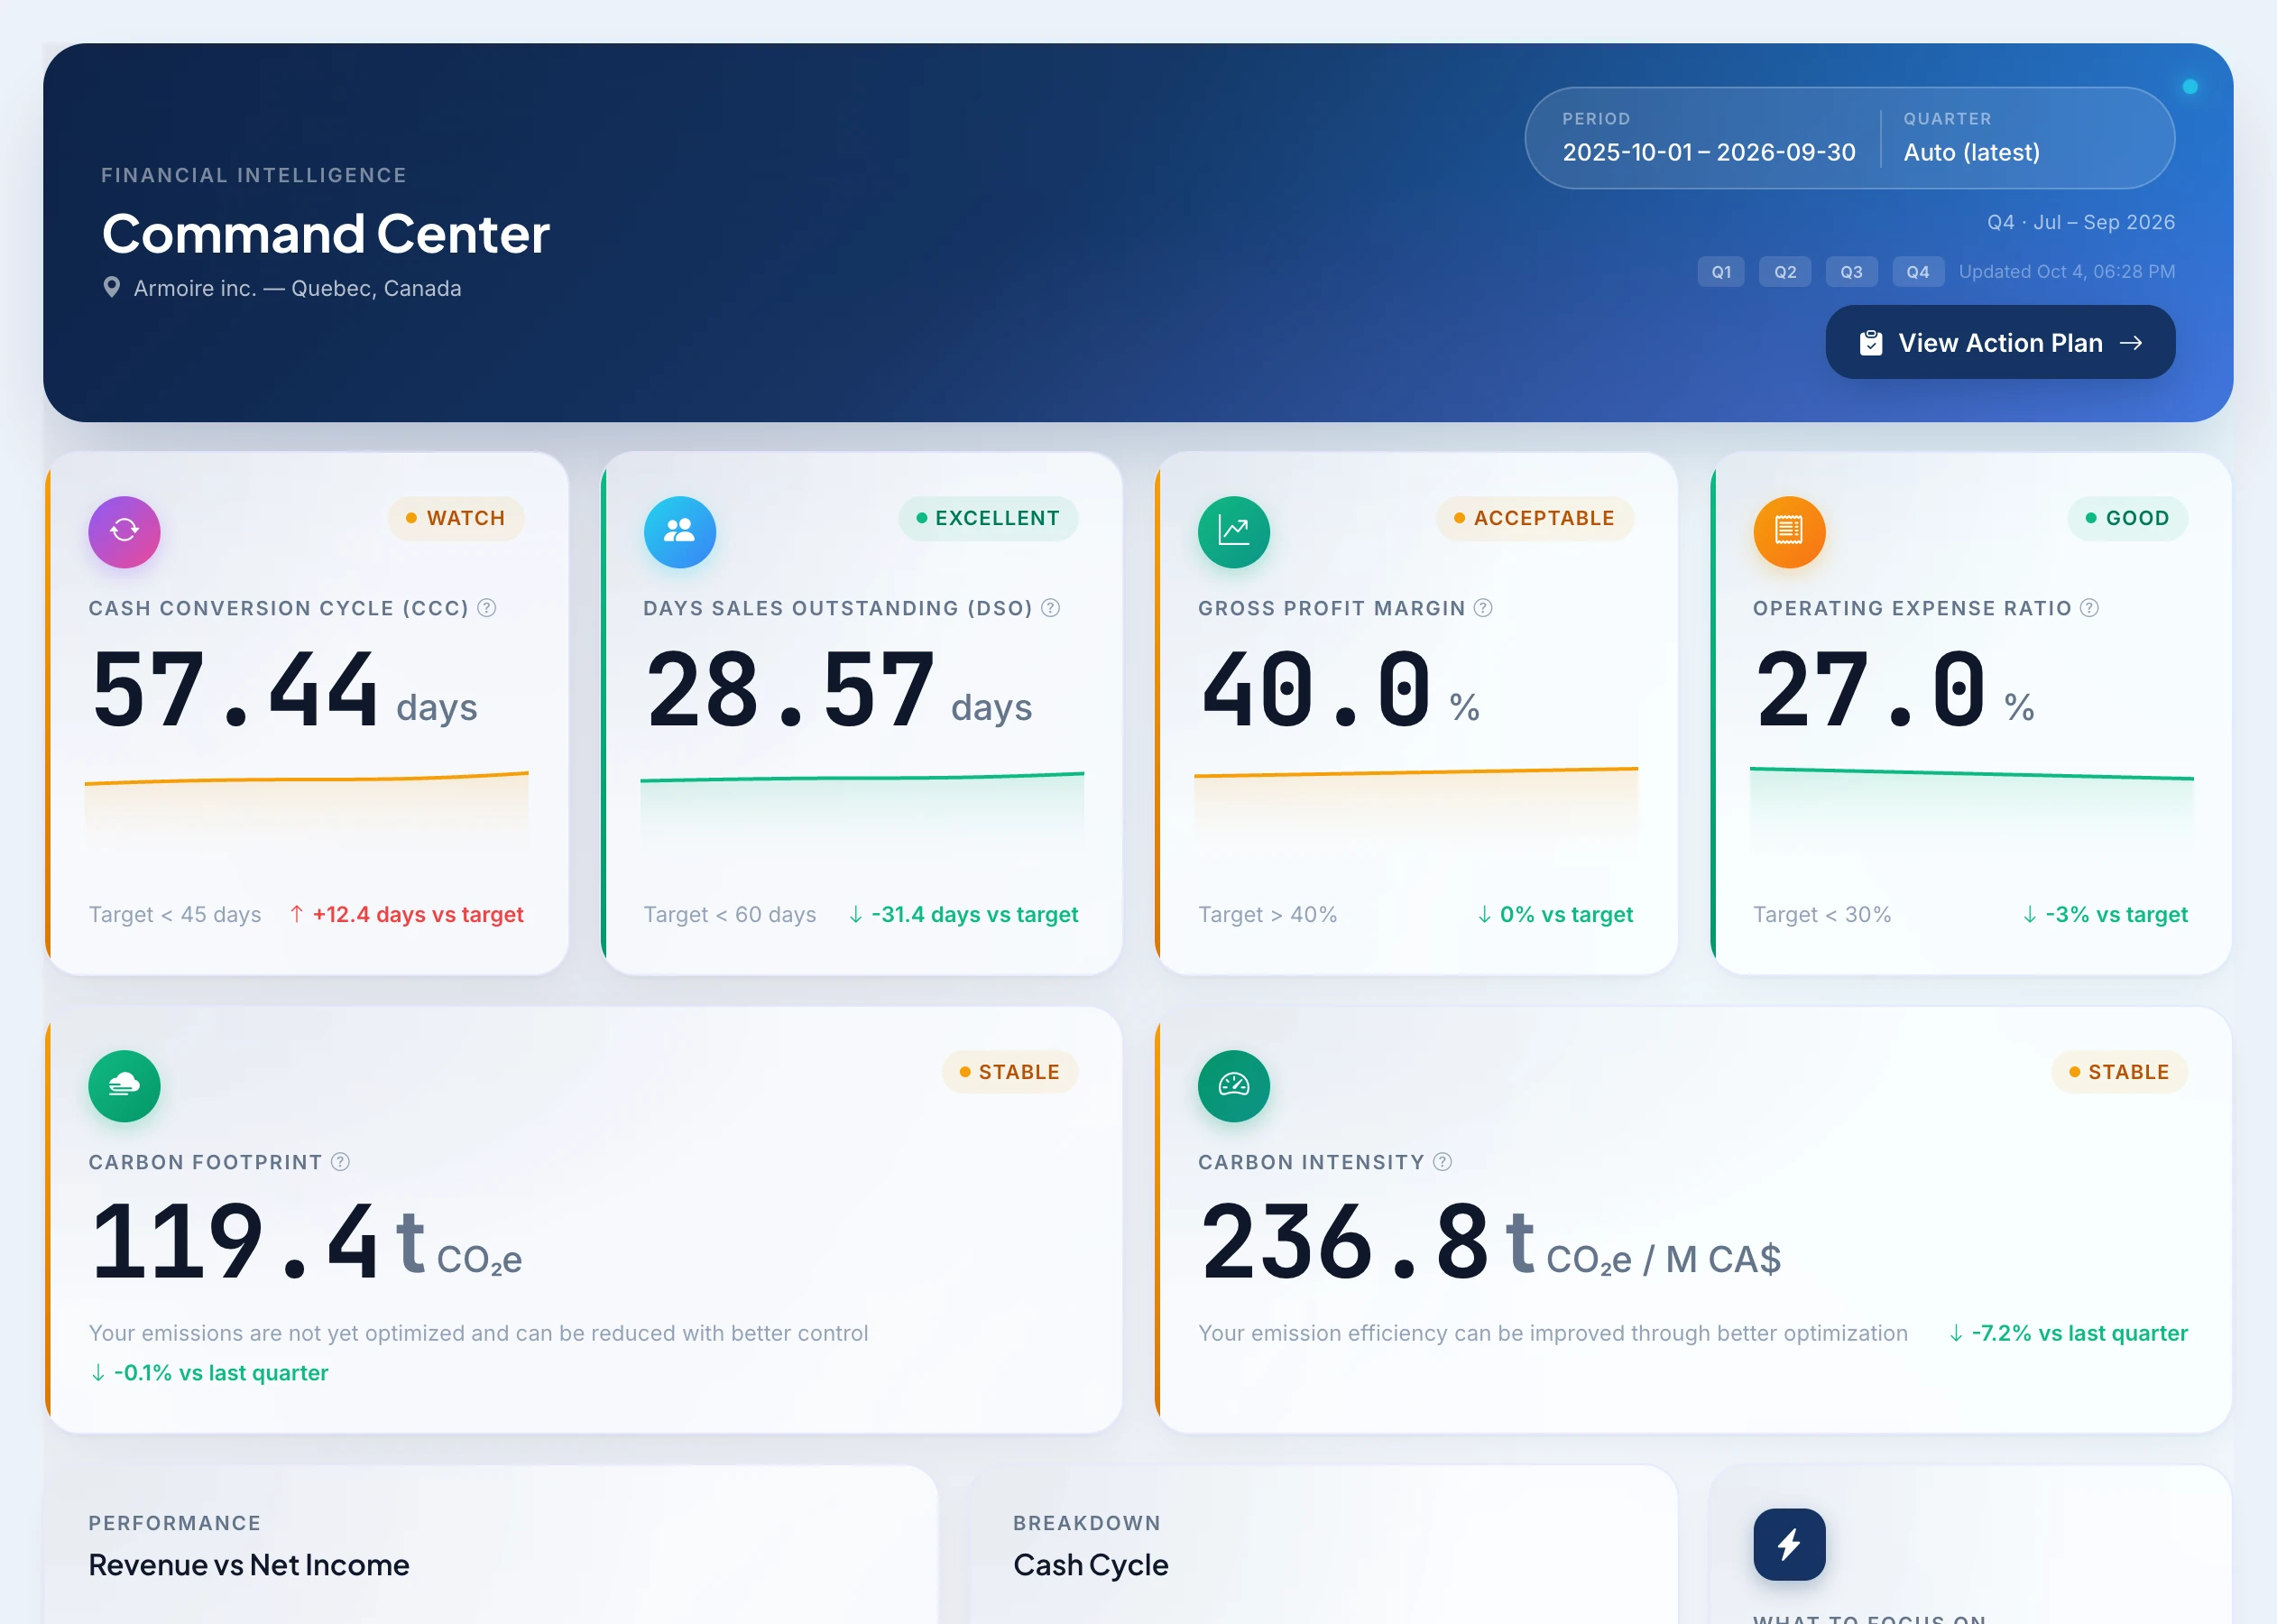
The Command Center compares every indicator with its target. Here, the cash conversion cycle reaches 57.44 days against a 45-day target.
02
The explanation
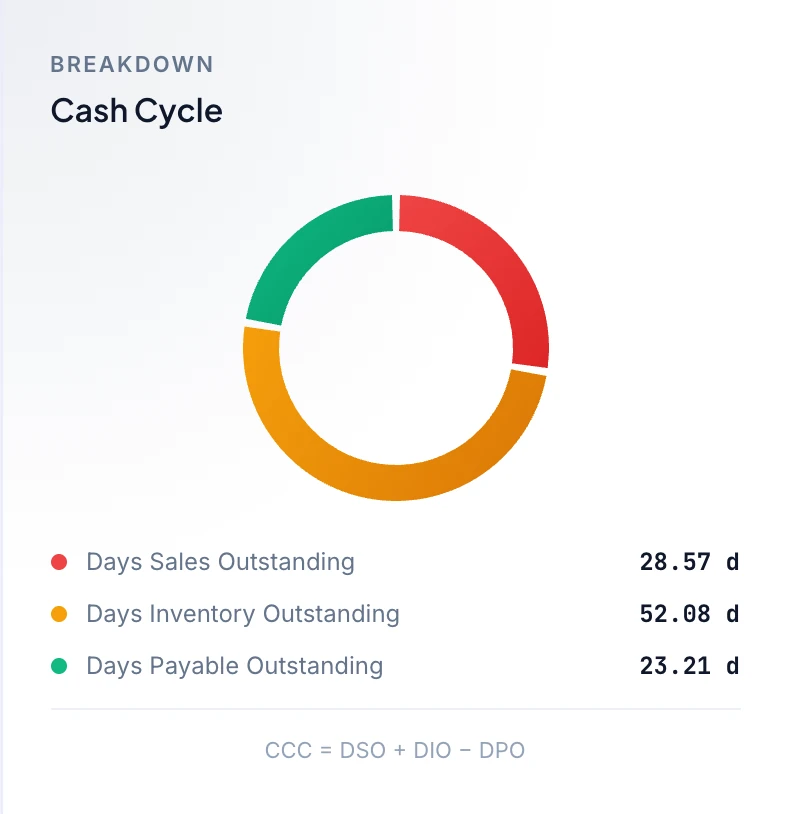
SUSTYC breaks the gap down into collections, inventory and supplier payments. Inventory, at 52 days, weighs the most.
03
The action
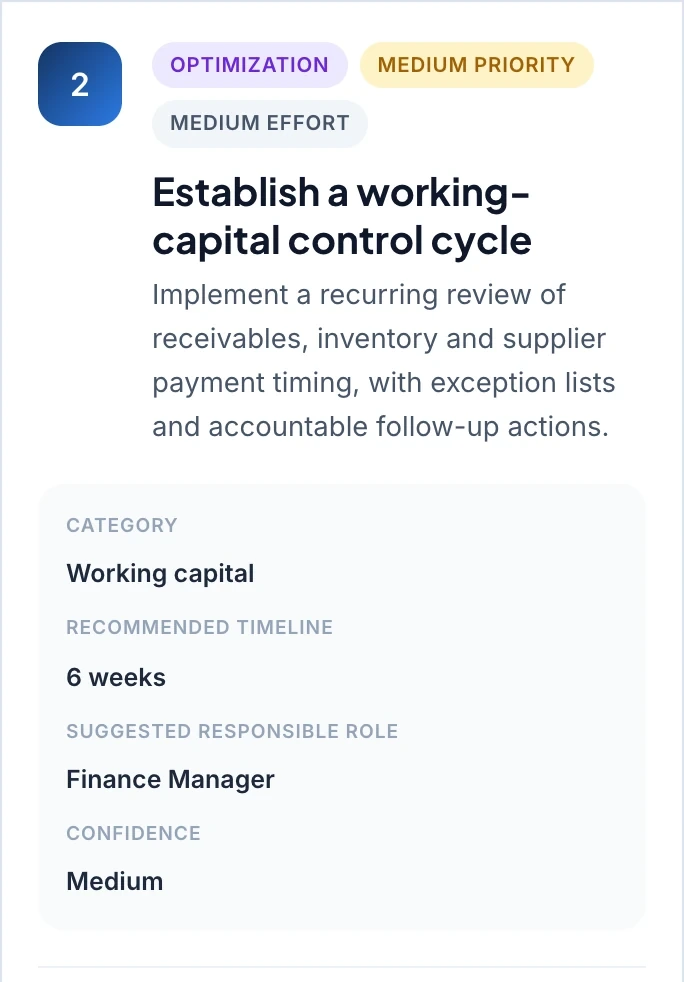
The AI-assisted action plan proposes a specific action, with a timeline, a suggested owner role and a confidence level.
04
The decision
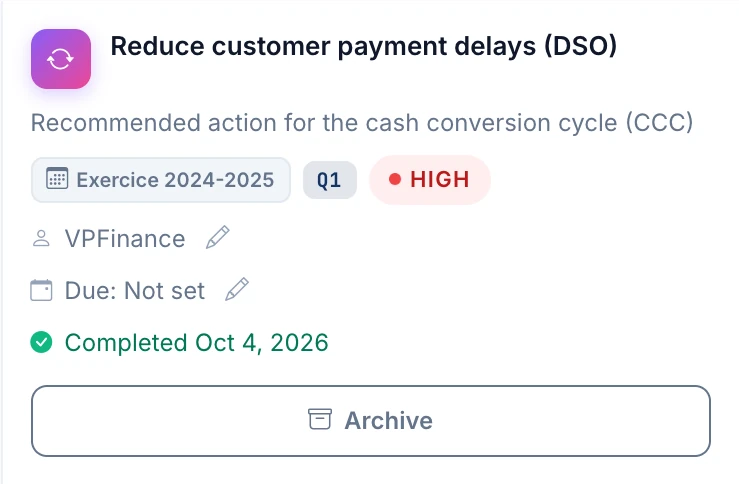
Your managers choose the actions, assign them and track their execution on the Kanban through to completion.
The platform
Explore the Command Center.
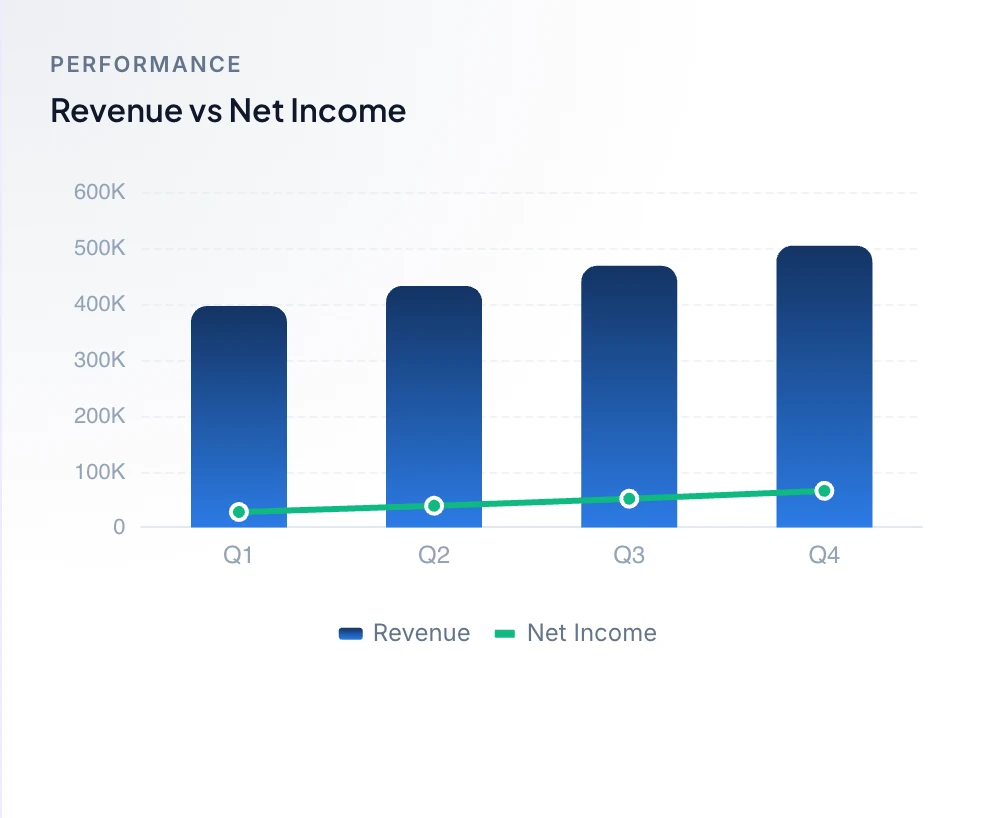
Your financial, operational and carbon indicators, their targets and statuses, quarter after quarter. The Platform page also covers the SCORE model, the carbon inventory, the action plan and the Academy.
- 01Command Center
- 02SCORE model
- 03Carbon and product footprint
- 04AI action plan and Kanban
- 05SUSTYC Academy
Let's see what SUSTYC can reveal in your numbers.
A guided demonstration of the platform, from your indicators to the action plan.